1
2
3
4
5
6
7
8
9
10
11
12
13
14
15
16
17
18
19
20
21
22
23
24
25
26
27
28
29
30
31
32
33
34
35
36
37
38
39
40
41
42
43
44
45
46
47
48
49
50
51
52
53
54
55
56
57
58
59
60
61
62
63
64
65
66
67
68
69
70
71
72
73
74
75
76
77
78
79
80
81
82
83
84
85
86
87
88
89
90
91
92
93
94
95
96
97
98
99
100
101
102
103
104
105
106
107
108
109
110
111
112
113
114
115
116
117
118
119
120
121
122
123
124
125
126
127
128
129
130
131
132
133
134
135
136
137
138
139
140
141
142
143
144
145
146
147
148
149
150
151
152
153
154
155
156
157
158
159
160
161
162
163
164
165
166
167
168
169
170
171
172
173
174
175
176
177
178
179
180
181
182
183
184
185
186
187
188
189
190
191
192
193
194
195
196
197
198
199
200
201
202
203
204
205
206
207
208
209
210
211
212
213
214
215
216
217
218
| [root@lab102 plotly]
import dash
from dash import dcc, html
from dash.dependencies import Input, Output
import pandas as pd
import plotly.express as px
import subprocess
import threading
import time
vdbench_output_dir = "/root/vdbench/output"
vdbench_bin = "/root/vdbench/vdbench"
plotdir = "/root/plotly/output/"
plotdata = "%s/data.csv" %(plotdir)
parse_command = "%s parse -i %s/flatfile.html -c Interval rate resp read_rate read_resp write_rate write_resp mb_read mb_write mb/sec xfersize mkdir_rate mkdir_resp -o %s 2>/dev/null" % (vdbench_bin, vdbench_output_dir, plotdata)
copy_config = "cat %s/parmfile.html > %s/config.txt 2>/dev/null " %(vdbench_output_dir,plotdir)
copy_summary = "cat %s/summary.html > %s/summary.txt 2>/dev/null" %(vdbench_output_dir,plotdir)
try:
print("执行拷贝配置文件命令...")
subprocess.run(copy_config, shell=True, check=True)
except subprocess.CalledProcessError as e:
print(f"执行拷贝配置文件失败: {e}")
config_file_path = "%s/config.txt" %(plotdir)
try:
with open(config_file_path, "r") as file:
lines = file.readlines()
config_content = ''.join(lines[4:])
print("配置文件内容已成功读取并保存到变量 config_content 中。")
except FileNotFoundError:
print(f"错误:文件 {config_file_path} 未找到。")
except Exception as e:
print(f"读取文件时发生错误:{e}")
def run_vdbench_periodically(interval=10):
while True:
try:
subprocess.run(parse_command, shell=True, check=True)
except subprocess.CalledProcessError as e:
print(f"Vdbench 解析失败: {e}")
time.sleep(interval)
threading.Thread(target=run_vdbench_periodically, daemon=True).start()
summary_file_path = "%s/summary.txt" %(plotdir)
def run_summary_periodically(interval=10):
while True:
try:
subprocess.run(copy_summary, shell=True, check=True)
except subprocess.CalledProcessError as e:
print(f"summary 拷贝失败: {e}")
time.sleep(interval)
threading.Thread(target=run_summary_periodically, daemon=True).start()
app = dash.Dash(__name__)
app.layout = html.Div([
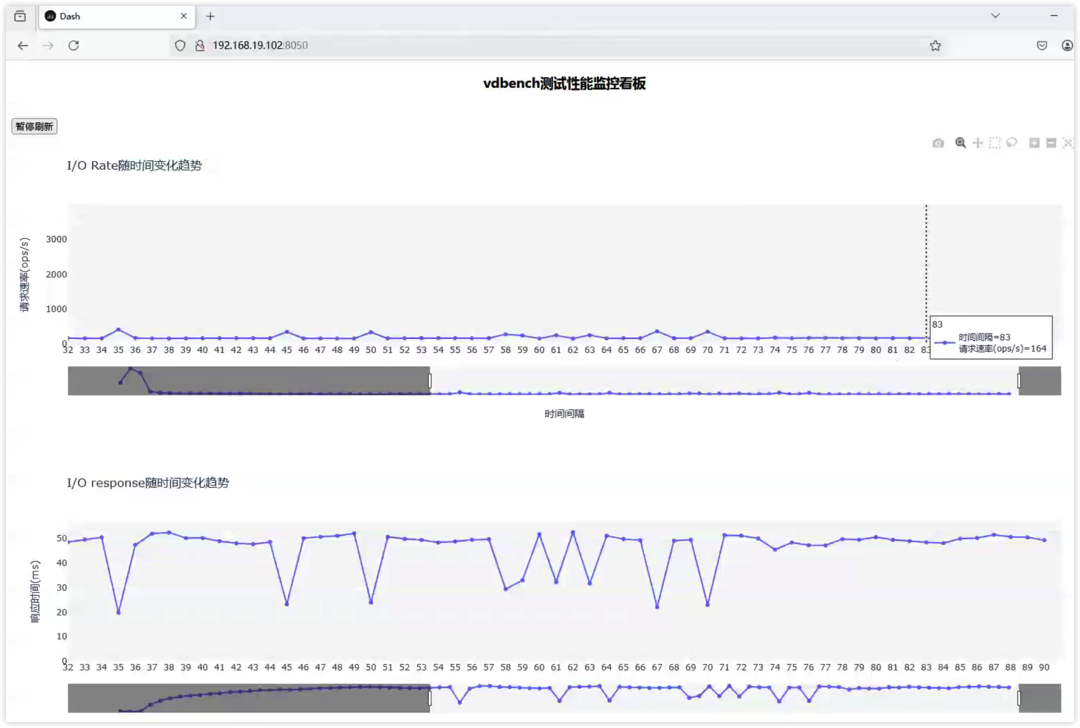
html.H3("vdbench测试性能监控看板", style={'textAlign': 'center'}),
html.Button("暂停刷新", id='pause-button', n_clicks=0, style={'marginTop': 20}),
dcc.Graph(id='graph-rate'),
dcc.Graph(id='graph-resp'),
dcc.Graph(id='graph-read-rate'),
dcc.Graph(id='graph-read-resp'),
dcc.Graph(id='graph-write-rate'),
dcc.Graph(id='graph-write-resp'),
dcc.Graph(id='graph-mb-read'),
dcc.Graph(id='graph-mb-write'),
dcc.Graph(id='graph-mb'),
dcc.Interval(
id='interval-update',
interval=10000,
n_intervals=0,
disabled=False
),
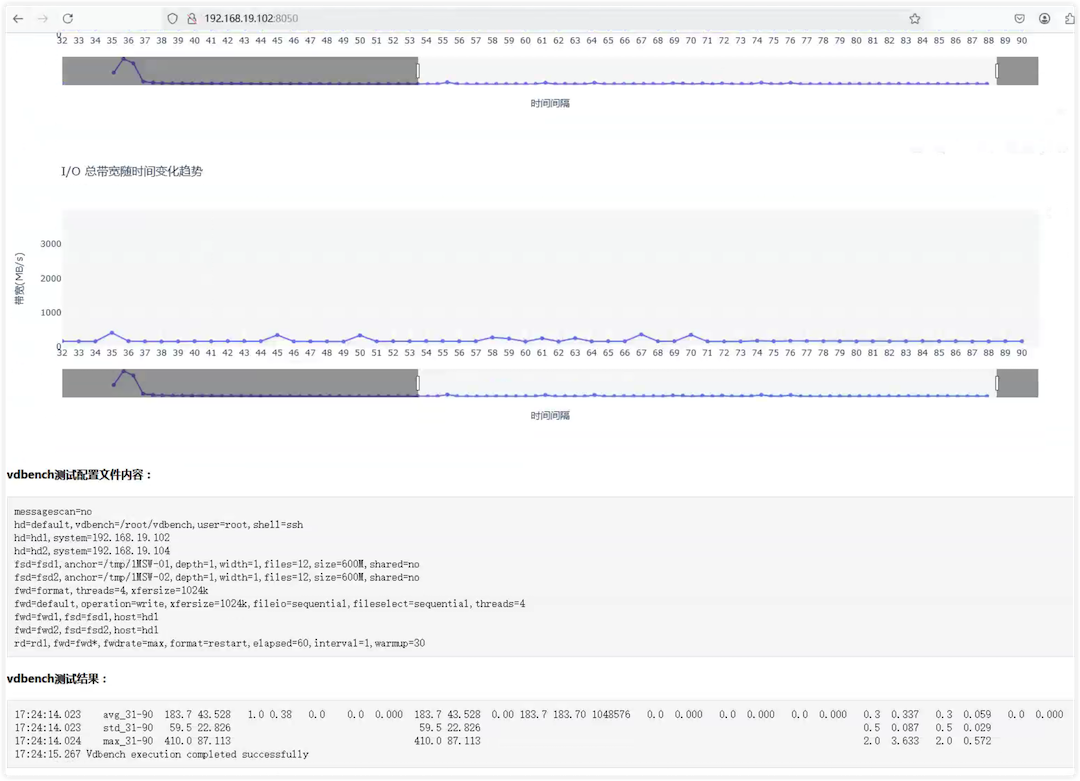
html.H4("vdbench测试配置文件内容:", style={'marginTop': 20}),
html.Pre(config_content, style={
'backgroundColor': '#f5f5f5',
'padding': '10px',
'border': '1px solid #ddd',
'whiteSpace': 'pre-wrap',
'overflowX': 'auto'
}),
html.H4("vdbench测试结果:", style={'marginTop': 20}),
html.Pre(id='summary_content', style={
'backgroundColor': '#f5f5f5',
'padding': '10px',
'border': '1px solid #ddd',
'whiteSpace': 'pre-wrap',
'overflowX': 'auto'
}),
])
@app.callback(
Output('summary_content', 'children'),
Input('interval-update', 'n_intervals')
)
def update_summary(n_intervals):
"""
每次 interval 触发时,更新 summary_content 的内容
"""
try:
with open(summary_file_path, "r") as file:
lines = file.readlines()
if lines and "Vdbench execution completed successfully" in lines[-1]:
summary_content = ''.join(lines[-4:])
summary_data=summary_content
else:
summary_data = "summary未生成"
except FileNotFoundError:
summary_data = "summary未生成"
return summary_data
@app.callback(
[
Output('graph-rate', 'figure'),
Output('graph-resp', 'figure'),
Output('graph-read-rate', 'figure'),
Output('graph-read-resp', 'figure'),
Output('graph-write-rate', 'figure'),
Output('graph-write-resp', 'figure'),
Output('graph-mb-read', 'figure'),
Output('graph-mb-write', 'figure'),
Output('graph-mb', 'figure'),
Output('interval-update', 'disabled'),
],
[Input('interval-update', 'n_intervals'),
Input('pause-button', 'n_clicks')]
)
def update_graphs(n_intervals, n_clicks):
is_paused = n_clicks % 2 == 1
try:
df = pd.read_csv(plotdata, header=0, skiprows=[1])
fig_rate = px.line(df, x='Interval', y='rate', title='I/O Rate随时间变化趋势',
labels={'rate': '请求速率(ops/s)', 'Interval': '时间间隔'}, markers=True)
fig_resp = px.line(df, x='Interval', y='resp', title='I/O response随时间变化趋势',
labels={'resp': '响应时间(ms)', 'Interval': '时间间隔'}, markers=True)
fig_read_rate = px.line(df, x='Interval', y='read_rate', title='I/O 读取请求速率随时间变化趋势',
labels={'read_rate': '读取请求速率(ops/s)', 'Interval': '时间间隔'}, markers=True)
fig_read_resp = px.line(df, x='Interval', y='read_resp', title='I/O 读取response随时间变化趋势',
labels={'read_resp': '响应时间(ms)', 'Interval': '时间间隔'}, markers=True)
fig_write_rate = px.line(df, x='Interval', y='write_rate', title='I/O 写入请求速率随时间变化趋势',
labels={'write_rate': '请求速率(ops/s)', 'Interval': '时间间隔'}, markers=True)
fig_write_resp = px.line(df, x='Interval', y='write_resp', title='I/O 写入response随时间变化趋势',
labels={'write_resp': '响应时间(ms)', 'Interval': '时间间隔'}, markers=True)
fig_mb_read = px.line(df, x='Interval', y='mb_read', title='I/O 读取带宽随时间变化趋势',
labels={'mb_read': '带宽(MB/s)', 'Interval': '时间间隔'}, markers=True)
fig_mb_write = px.line(df, x='Interval', y='mb_write', title='I/O 写入带宽随时间变化趋势',
labels={'mb_write': '带宽(MB/s)', 'Interval': '时间间隔'}, markers=True)
fig_mb = px.line(df, x='Interval', y='mb/sec', title='I/O 总带宽随时间变化趋势',
labels={'mb/sec': '带宽(MB/s)', 'Interval': '时间间隔'}, markers=True)
x_range = df['Interval'].iloc[-60:].values
for fig in [fig_rate, fig_resp, fig_read_rate, fig_read_resp, fig_write_rate, fig_write_resp, fig_mb_read, fig_mb_write, fig_mb]:
fig.update_yaxes(range=[0, None])
fig.update_layout(
plot_bgcolor='#f5f5f5',
hovermode='x unified',
xaxis=dict(
tickmode='linear',
dtick=1,
type='category',
rangeslider=dict(visible=True),
range=[x_range[0], x_range[-1]]
)
)
return [fig_rate, fig_resp, fig_read_rate, fig_read_resp, fig_write_rate, fig_write_resp, fig_mb_read, fig_mb_write, fig_mb, is_paused]
except Exception as e:
print(f"读取 CSV 失败: {e}")
return dash.no_update
if __name__ == '__main__':
app.run_server(debug=False, host='0.0.0.0', port=8050)
|